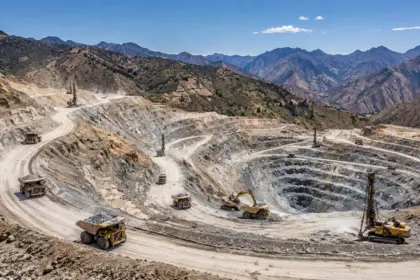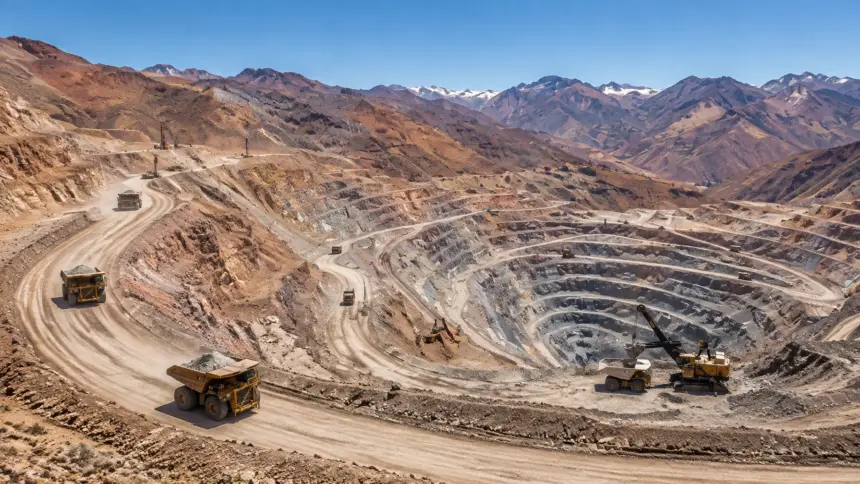
An open-pit copper mine in an arid Andean landscape, with terraced benches and haulage equipment visible across the operation.
Chile’s copper industry has delivered a fresh warning to a market already struggling to secure concentrate. July output fell to its lowest level for that month since 2011, while Chilean government copper commission Cochilco cut its 2026 national production forecast to 5.27 million tonnes.
The decline matters beyond Chile. Global mine output fell 1.1% in the first half of the year, and benchmark treatment and refining charges (TC/RCs) have moved to record lows, including zero and negative spot assessments in parts of the concentrate market. Together, those signals point to a copper market with less supply flexibility just as demand from power grids, artificial intelligence infrastructure and electrification remains strong.
For operators, smelters and investors, the central question is no longer simply whether copper demand will grow. It is whether enough mine supply can arrive quickly enough to prevent a widening deficit.
Chile’s output slump exposes a narrow supply cushion
Chile produced 403,424 tonnes of copper in July, down 9.4% year over year and below the previous month, according to data from Chile’s statistics agency reported by Mining Weekly.
Severe winter weather disrupted operations in the northern mining belt, while maintenance at major sites added to the decline. The result was the weakest July production level in 15 years. Although some of the disruption may prove temporary, the monthly data arrives against a broader backdrop of aging infrastructure, declining ore grades, water constraints and delayed project development.
Cochilco’s revised forecast of 5.27 million tonnes for 2026 confirms that the country is unlikely to provide a major supply release during the year. Chile remains the world’s largest copper producer, so even a modest change in its output has a disproportionate effect on global concentrate availability.
A single weak month does not automatically create a global deficit. But when Chile underperforms while other producers face operational disruptions and global mine output is already down, the market’s buffer becomes smaller.

Terraced benches and haulage routes illustrate the scale and logistical complexity of Andean copper production.
Why the 1.1% decline in global mine supply matters
Global mine output declined 1.1% in the first half, according to market data cited in current copper assessments. That figure may appear modest beside total annual production, but copper markets are highly sensitive to small changes in availability.
Refined copper consumption is measured in tens of millions of tonnes annually. A supply shortfall of a few hundred thousand tonnes can therefore represent a meaningful share of available inventories, particularly when exchange stocks are unevenly distributed across regions.
The market is also facing a long development cycle. New copper mines can require years of permitting, construction and commissioning. Brownfield expansions may arrive faster, but they still depend on capital availability, infrastructure and stable operating conditions. High prices can improve project economics without immediately adding production.
That timing mismatch is important for the 2026 forecast. A higher copper price can encourage new supply over the long term, but it cannot quickly replace tonnes lost to weather, maintenance, lower grades or an unexpected disruption at a large mine.
Record-low TC/RCs reveal stress beneath the price
Treatment charges and refining charges are deductions paid from the value of copper concentrate to compensate smelters and refiners for processing it. When concentrate is plentiful, smelters can demand higher charges. When mine supply is tight, they compete for feedstock and charges fall.
That process has reached an extreme point. Spot TC/RC assessments have moved to zero or negative levels in parts of the market. Skillings previously examined the significance of the shift in its analysis of copper smelter fees and negative treatment charges.
A negative spot treatment charge does not mean every annual contract has turned negative. Contract terms vary according to quality, impurities, freight, delivery terms and the relationship between the miner and smelter. Even so, the signal is clear: smelters are competing aggressively for limited concentrate.
That creates a difficult operating environment for refiners. Smelters still face power, labor, maintenance and environmental-compliance costs, but their traditional processing income is being squeezed. Some facilities may continue operating because of by-product revenue from sulfuric acid, gold and silver. Others could reduce utilization or defer maintenance if margins remain under pressure.

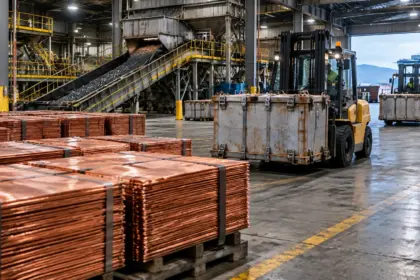
Copper anodes move through a smelter casting area as concentrate scarcity puts pressure on processing margins.
The effect could become self-reinforcing. Lower mine supply tightens concentrate markets, which reduces smelter margins. If high-cost smelters cut production, refined copper availability can tighten further, even if nominal refining capacity remains ample.
Copper demand is being pulled in two directions
Copper demand remains supported by long-term investment in transmission lines, substations, renewable power, electric vehicles, charging infrastructure and data centers.
AI-related construction is particularly relevant because data centers require large amounts of power infrastructure. The copper intensity is not limited to the server equipment itself. It extends across transformers, cables, switchgear, cooling systems and grid connections.
Goldman Sachs has identified grid and power infrastructure as a major source of future copper demand growth, while J.P. Morgan’s copper outlook highlights both structural supply constraints and the market’s sensitivity to economic growth.
The demand picture is not uniformly strong. Copper remains exposed to Chinese property activity, manufacturing conditions, interest rates and broader industrial growth. At elevated prices, fabricators may increase scrap usage, substitute aluminum where technically possible or delay nonessential projects.
That creates a tension at the heart of the forecast. The energy transition and AI infrastructure provide durable demand drivers, but high prices can produce short-term demand destruction. The market must therefore balance structural growth against cyclical weakness.
Copper supply and price indicators
The following table brings together the main indicators shaping the 2026 outlook.
| Indicator | Current reference | Implication for the market |
|---|---|---|
| Chilean July production | 403,424 tonnes | Lowest July level since 2011; confirms near-term supply weakness |
| Chilean 2026 production forecast | 5.27 million tonnes | Cochilco’s downgrade reduces the likelihood of a major supply rebound |
| Global mine output | Down 1.1% in H1 | Leaves less flexibility to absorb disruptions |
| Benchmark and spot TC/RCs | Zero or negative in parts of the market | Shows smelters competing for scarce concentrate |
| U.S. warehouse stocks | About 700,000 tonnes | Potential source of downside supply if tariff expectations fade |
| Grid and AI demand | Structural growth driver | Supports copper consumption despite weakness in traditional sectors |
| 2026 base case | $11,500–$12,500/t | Tight supply, but no full-scale physical squeeze |
| 2026 bull case | $13,000–$15,000/t | Disruptions, tariffs and strong infrastructure demand reinforce one another |
| 2026 bear case | $10,000–$11,200/t | Tariff rejection and inventory release offset mine-supply weakness |
Sources: Mining Weekly, J.P. Morgan, Goldman Sachs and Skillings market analysis.
Copper price forecast scenarios
These ranges are analytical scenarios rather than investment recommendations.
Base case: $11,500–$12,500 per tonne
The base case assumes that Chile recovers part of its lost production but remains below its earlier trajectory. Other mine disruptions continue to restrict concentrate availability, while TC/RCs remain historically low.
Demand from grid investment, data centers and electrification offsets weaker construction and uneven Chinese industrial activity. The market remains tight, but available inventories and some recovery in mine supply prevent a sustained price spike.
Under this scenario, copper averages in the low-$12,000s. Smelters continue operating, but margins remain under pressure and negotiations with miners remain difficult.
Bull case: $13,000–$15,000 per tonne
The bull case requires several risks to converge.
Chilean production would remain weak, while additional disruptions at major mines reduce global output further. At the same time, demand from power grids and AI infrastructure would remain resilient. A U.S. tariff on refined copper would add another layer of competition for metal outside the United States.
The estimated 700,000 tonnes of copper in U.S. warehouses would become strategically important in this scenario. If tariffs restrict new imports, those stocks could remain concentrated in the United States rather than returning to the wider seaborne market. That would tighten availability in Europe and Asia.
With smelters already competing for concentrate, a move toward $15,000/t would reflect competition for deliverable units rather than speculation alone.
Bear case: $10,000–$11,200 per tonne
The bear case begins with a rejection, delay or significant narrowing of refined copper tariffs.
Without a tariff incentive, some of the approximately 700,000 tonnes held in U.S. warehouses could be released into the broader market. That would improve regional availability and reduce the policy premium embedded in prices.
A recovery in Chile, higher scrap flows and weaker Chinese demand would reinforce the decline. Copper could move toward $10,000–$11,200/t, even if the long-term outlook for grid investment and electrification remained constructive.
This would not necessarily signal the end of the copper supply challenge. It would indicate that inventory release and demand adjustment had temporarily outweighed mine-supply weakness.
What decision-makers should monitor
The most useful indicators over the coming months will be physical-market data rather than the headline copper price alone:
- Chilean monthly production: A second weak month would suggest the July decline is more than a weather-related interruption.
- TC/RC settlements: Persistent zero or negative charges would confirm continued concentrate scarcity.
- U.S. warehouse movements: Withdrawals and cancellations will show whether the 700,000-tonne stockpile is available to the wider market.
- LME cash-to-three-month spreads: Sustained backwardation would indicate tight nearby supply.
- Chinese imports and premiums: These will help determine whether demand is recovering or weakening.
- Scrap availability: Higher secondary supply could limit upside while mine output remains constrained.
- Smelter utilization: Production cuts would tighten refined supply and potentially widen regional premiums.
Chile’s 15-year July output low does not guarantee a deficit, but it makes a deficit more likely if other producers fail to compensate. The combination of lower global mine output, Cochilco’s 5.27-million-tonne forecast and record-low TC/RCs shows that the market has little room for another major disruption.
For now, the most balanced view is a $11,500–$12,500/t base case, with a path to $13,000–$15,000/t if supply disruptions and tariff-driven stock concentration intensify. The downside case toward $10,000–$11,200/t depends on policy relief and the release of U.S. warehouse stocks.
The defining issue for copper in 2026 is not only how much metal exists. It is where that metal is located, whether it can be delivered and which part of the value chain has the pricing power to secure it.
Social snippets
LinkedIn:
Chile’s copper output hit its lowest July level since 2011, while Cochilco cut its 2026 national production forecast to 5.27 million tonnes. With global mine output down 1.1% in H1 and TC/RCs at zero or negative levels, our copper forecast examines the $11,500–$15,000/t supply scenarios.
X:
Copper’s 2026 outlook hinges on three variables: Chilean mine supply, near-zero or negative TC/RCs and the fate of roughly 700,000 tonnes in U.S. warehouse stocks. Base, bull and bear cases range from $10,000 to $15,000/t.