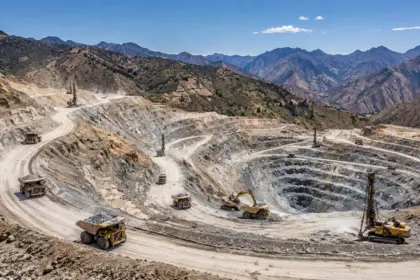

As gold prices continue to defy historical norms, the global mining community and financial markets are grappling with a singular question: is $5,000 gold a speculative fever dream or the next structural reality? By April 2026, the metal has already cleared several “impossible” hurdles, yet it faces a significant technical ceiling at $4,800.
The backdrop for this surge is not merely inflationary pressure. It is a fundamental shift in how global institutions value the “ultimate hedge.” With the World Bank recently detailing a cycle that includes a cumulative 42% uptick in commodity valuations for precious metals over the 2024-2026 period, the road to $5,000 is no longer just about safe-haven buying: it is about the structural depletion of trust in traditional fiat reserves and the rising costs of bringing new supply to market.
The World Bank’s 42% Cycle: Breaking Down the Bull Case
The World Bank’s Commodity Markets Outlook has been a primary driver of the current market sentiment. Their analysis points to a period of unprecedented price appreciation, noting that precious metals are projected to maintain levels roughly 150% higher than their 2015–2019 averages. The “42% uptick” narrative stems from the cumulative growth observed as global uncertainties refused to recede following the geopolitical realignments of 2024.
According to World Bank data, gold’s resilience is underpinned by two factors: persistent global risk and the weakening of the U.S. dollar’s role in international settlements. While the bank notes that prices could “ease modestly” if interest rates stabilize, the base case for 2026 remains bullish. The “ease” mentioned in their reports refers to a slowing of the rate of growth, rather than a crash, effectively setting a new, higher floor for the metal.
Technical Analysis: The $4,800 Resistance
From a technical perspective, the $4,800 mark has become the “Great Wall” of the 2026 gold market. Since the start of the year, gold has tested this level three times, only to be met with significant sell-side pressure.
Technical analysts point to several factors making $4,800 a difficult nut to crack:
- Profit Taking: Long-term institutional holders who entered the market during the 2022-2023 rallies are using the $4,800 mark to liquidate positions and reallocate capital into emerging critical minerals markets, such as Bokan Mountain rare earth projects.
- Options Gamma: There is a heavy concentration of “sell” orders and “put” options clustered at this psychological barrier, creating a self-fulfilling prophecy of resistance.
- Volume Exhaustion: While the trend is upward, the volume required to push through a 40%+ appreciation cycle is immense. The market currently lacks a fresh “shock” to catalyze a breakout.
However, should gold close above $4,800 for two consecutive weeks, the path to $5,000 becomes a technical vacuum. In that scenario, most algorithmic trading models shift to “aggressive buy,” likely pushing the price to the $5,000 milestone in a matter of days.

Central Bank Demand: The Structural Shift
Perhaps the most significant driver of the 2026 price target is the behavior of central banks. For decades, central banks were net sellers of gold. That trend has reversed with a vengeance. In 2025, central bank purchases reached record levels, and that momentum has carried into the second quarter of 2026.
This is not a temporary flight to safety; it is a structural diversification strategy. Emerging economies, particularly those in the BRICS+ bloc, are increasingly looking to insulate their reserves from Western sanctions and dollar-based volatility. As China implements stricter export controls on critical minerals, the geopolitical value of gold as a “neutral” asset has only increased.
| Year | Central Bank Net Purchases (Metric Tons) | Average Gold Price (USD/oz) | YoY Change |
|---|---|---|---|
| 2023 | 1,037 | $1,940 | +12% |
| 2024 | 1,150 (Est.) | $2,350 | +21% |
| 2025 | 1,280 (Est.) | $3,800 | +61% |
| 2026 (Q1/Q2) | 640 (YTD) | $4,650 | +22% |
Data Source: Skillings Mining Intelligence / World Gold Council Industry Analysis
Supply-Side Constraints: The Cost of Extraction
While demand is soaring, the ability of miners to respond is severely limited. The “easy gold” has been found. Modern mining operations are now dealing with lower grades, deeper deposits, and significantly higher ESG compliance costs.
In Ecuador’s Los Cangrejos gold-copper project, for instance, massive investment is required just to maintain production timelines amidst shifting regulatory landscapes. The cost of diesel, labor, and specialized mining equipment has risen by an average of 18% since 2024, meaning that even at $4,000+ per ounce, some marginal mines are only just breaking even.
This supply-side inelasticity means that price spikes don’t immediately lead to more gold on the market. It takes 7 to 10 years to bring a major new discovery online, leaving the 2026 market in a state of perpetual deficit.

Interest Rates and the “Safe Haven” Paradox
Traditionally, gold and interest rates have an inverse relationship. When rates go up, gold: which yields nothing: becomes less attractive. However, the 2026 market has broken this correlation. Despite central banks in the U.S. and Europe maintaining higher-for-longer rate stances to combat persistent service-sector inflation, gold has continued to climb.
This paradox exists because investors are no longer looking at “real yields” alone; they are looking at “sovereign risk.” With global debt-to-GDP ratios at all-time highs, the perceived safety of government bonds has eroded. Gold, with no counterparty risk, has reclaimed its status as the only asset that is “nobody else’s liability.”
The 2026 Outlook: Base, Bull, and Bear Cases
As we look toward the second half of 2026, the $5,000 question remains balanced on three potential scenarios:
- The Bull Case ($5,200 – $5,500): A geopolitical escalation in the Pacific or a sudden “hard landing” for the U.S. economy triggers a mass exodus from equities into bullion. Technical resistance at $4,800 is shattered in a high-volume breakout.
- The Base Case ($4,700 – $4,950): Gold continues to consolidate between $4,500 and $4,800. Central bank buying provides a solid floor, but lack of a new “crisis” keeps the metal from making the final run to $5,000.
- The Bear Case ($4,100 – $4,300): A resolution to major geopolitical conflicts combined with a faster-than-expected decline in inflation leads to a “risk-on” environment. Gold sees its first major correction in three years as speculative capital moves back into tech and growth stocks.
Conclusion: The New Reality of Value
Whether gold hits exactly $5,000 by December 31, 2026, is almost secondary to the broader point: the valuation of the metal has undergone a permanent shift. The 100+ year legacy of reporting at Skillings Mining Intelligence has seen many cycles, but the current convergence of de-dollarization, supply-side scarcity, and technical momentum is unique in the modern era.
For operators, this means a renewed focus on exploration and efficiency. For investors, it means a market where the “old rules” of interest rate correlations no longer apply. As we watch the $4,800 resistance levels, one thing is certain: the era of “cheap gold” is firmly in the rearview mirror.