The global mining sector is currently navigating a period of unprecedented capital realignment and operational volatility. As commodity prices breach historic resistance levels: most notably gold surpassing $4,100 per ounce and copper testing the $14,000 per ton mark: the industry has shifted from a stance of cautious capital preservation to aggressive consolidation. This shift is characterized by multi-billion dollar M&A activity and a fundamental restructuring of supply chains for critical minerals. For institutional investors and operators, the current landscape represents a pivotal moment where structural deficits are meeting a surge in industrial and geopolitical demand.
Mega-Deal M&A: NovaGold’s $4.2B Donlin Consolidation & the $11B July Wave
The centerpiece of the current M&A surge is NovaGold Resources Inc.’s definitive agreement to acquire the remaining 40% interest in Donlin Gold from Paulson Advisors. The $4.2 billion all-stock transaction will consolidate 100% of the project under a newly formed entity, NovaGold Corporation, which is slated for listing on the New York Stock Exchange.
Donlin Gold, located in the Kuskokwim Gold Belt of Alaska, remains one of the largest and highest-grade undeveloped open-pit gold deposits globally. With measured and indicated resources totaling approximately 39 million ounces at an average grade of 2.24 g/t, the project represents a tier-one asset in a low-risk jurisdiction. The timing of the consolidation is strategic; gold prices are currently trading between $4,100 and $4,130 per ounce, providing a robust economic backdrop for large-scale development. The transaction reflects a significant P/NAV (Price to Net Asset Value) premium, signaling that majors and large-scale developers are willing to pay for certainty in an increasingly fragmented global market.

This consolidation is not an isolated event. It is the flagship of an $11 billion M&A wave in July alone. Other notable transactions include the $4.1 billion Alcoa-South32 merger, SSR Mining’s $1.49 billion partnership with Cengiz in Turkey, and the A$5.6 billion Genesis-Vault deal in Australia. The primary driver behind this rush is the deep valuation gap in the sector; despite record bullion prices, gold miners have been trading at an average 19% discount to their Net Asset Value (NAV). For cashed-up majors, the current environment presents a unique window to acquire high-quality ounces at a discount to replacement cost.
Copper Supply Crisis: $14,000/Ton and the Structural Deficit
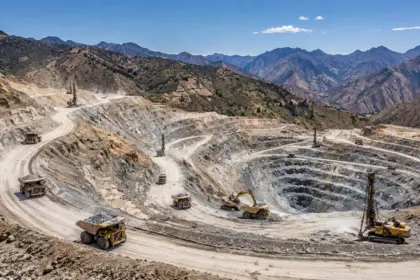
The copper market has entered a state of acute crisis as supply-side shocks intersect with relentless demand from AI infrastructure and data center cooling systems. In Chile, the world’s leading producer, record atmospheric river storms have forced the temporary suspension of operations at major assets including Caserones, Escondida, and El Teniente. This has effectively removed approximately 1.6 million tonnes per year of capacity from the global market.
Compounding the production halts is a severe sulfuric acid crisis. Prices for the chemical, essential for copper leaching operations, have skyrocketed from approximately $190 per ton to over $450 per ton in certain regions. The shortage of acid, coupled with logistical bottlenecks, has made it nearly impossible for some hydrometallurgical plants to maintain output targets.

As a result, London Metal Exchange (LME) copper prices have surged past $14,000 per ton. Benchmark Mineral Intelligence (BMI) has subsequently hiked its copper price forecast by 6.7%, with market consensus now settling between $11,000 and $13,200 per ton for the remainder of the cycle. Beyond the weather-related disruptions, the structural deficit is being driven by the massive power requirements of AI data centers, which utilize significantly more copper in their electrical systems and cooling loops than traditional server farms.
Royalty & Streaming Intelligence: The Primary Capital Source
As equity markets remain selective, the royalty and streaming sector has solidified its position as the primary source of non-dilutive capital for developers. Recent activity highlights the scale of these transactions:
- Empress Royalty: Acquired a diverse 14-royalty portfolio from Almadex Minerals for $2.5 million, continuing its strategy of consolidating small-scale, high-margin royalties.
- Elemental Royalty: Executed a $25 million hybrid deal in Peru with Quilla Resources, focusing on near-term copper production.
- Wheaton Precious Metals: Announced a massive $4.3 billion silver stream acquisition from BHP’s interest in the Antamina mine.
These deals demonstrate that the streaming model is no longer just for precious metals; it is becoming a critical tool for financing copper and base metal expansions. Developers are increasingly utilizing these structures to bypass the high cost of traditional debt and equity in a volatile interest rate environment.
Commodity Price Forecast Tables & P/NAV Benchmarks
The following data sets represent the current consensus for the 2026 outlook and the valuation benchmarks being used by institutional analysts to identify M&A targets.
COMMODITY PRICE FORECAST TABLE (2026 Outlook)
| Commodity | Spot Price Range | 2026 Forecast (Consensus) | Key Driver |
|---|---|---|---|
| Gold | $4,100 – $4,130/oz | $4,250–$4,700/oz | Central Bank Buying / Inflation |
| Silver | $55 – $59/oz | $65–$81/oz | 6th Year of Structural Deficit |
| Copper | $13,500 – $14,000/t | $11,000 – $13,200/t | Chile Supply Shocks / AI Data Centers |
| Uranium | $84 – $92/lb | $95–$120/lb (LT) | SMR Adoption / Decarbonization |
| Lithium | $18,000 – $25,000/t (LCE) | $18,000 – $25,000/t | Storage Demand / Structural Tightening |
P/NAV WATCH TABLE
| Sector | Current P/NAV Range | Investment Sentiment |
|---|---|---|
| Majors | 0.9x – 1.1x | Fairly valued; focused on dividends |
| Tier-1 Producers | 1.1x – 1.4x | Premium for operational stability |
| Developers | 0.5x – 0.8x | High upside; M&A targets |
| Gold Juniors | 0.30x – 0.55x | Deeply undervalued; prime M&A targets |
| Lithium Juniors | 0.50x – 0.70x | Discounted on execution risk/oversupply |
Critical Minerals & Rare Earths: China’s 800% Price Surge
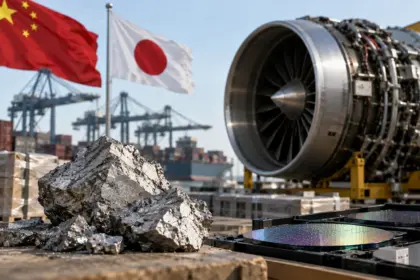
Geopolitical friction has returned as a dominant price driver for critical minerals. China’s recent tightening of rare earth export controls has triggered an 800% price surge in dysprosium and terbium over the last 90 days. In a retaliatory move, major Western entities including MP Materials and USA Rare Earth have been added to the Chinese export-control list, effectively cutting off their access to specialized processing chemicals.

This escalation has accelerated Western investment in midstream processing by 40% in just two months. The market is now focused on the November 10 “Busan Stand-down” deadline, a diplomatic window where several G7 nations are expected to negotiate a temporary ceasefire on trade restrictions. The urgency to secure supply ahead of this deadline is driving significant price premiums for non-Chinese material.
Uranium: Structural Bull Market and SMR Demand
The uranium sector is experiencing its most significant bull market in nearly two decades. Long-term contract prices have reached an 18-year high of $94/lb, while spot prices maintain a range of $84 to $92/lb. The demand side is being fundamentally reshaped by the rapid adoption of Small Modular Reactors (SMRs), which are being integrated directly into industrial grids to support decarbonization efforts.

While Cameco’s restart of the Cigar Lake operation has provided some relief to the near-term supply-demand balance, the long-term outlook remains tight. Utilities are now prioritizing security of supply over price, leading to multi-year contracts that provide strong floor pricing for producers. The restructuring of the nuclear fuel cycle away from Russian enrichment services has further intensified the focus on North American and Australian primary production.
Secure Your Copy of the 2026 Lithium Power Map
The lithium market is undergoing a radical shift. Our ‘2026 Lithium Power Map’ provides an exhaustive look at the projects, players, and logistics shaping the next decade of battery metal supply. Pre-sale is now open at $59.
Access the 2026 Lithium Power Map Pre-sale Here