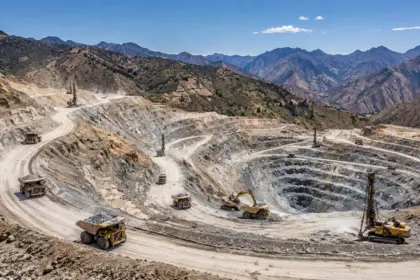
A working copper mine in Chile illustrates the scale and infrastructure required to add new supply.
Copper has crossed a critical market milestone in 2026: prices have moved above previous records while the physical market has become increasingly divided between well-stocked U.S. warehouses and tighter availability elsewhere.
J.P. Morgan Global Research said copper briefly surpassed $14,500 per metric tonne at the start of the year. Goldman Sachs Research separately recorded a $13,387/t high in January after copper rose 22% from late 2025 levels. The exact peak varies by benchmark and timing, but the direction is clear: copper has entered a new volatility regime.
The central question for operators, fabricators and investors is whether these prices reflect a lasting supply shortage or a temporary combination of tariff-driven stockpiling, low visible inventories and mine disruptions.
Our base case is for copper to remain historically expensive but below its sharpest peaks for much of the year. The bull case requires further mine outages or renewed trade-driven buying. The bear case depends on inventory normalization, weaker industrial demand and stronger scrap flows.
Copper market snapshot
| Indicator | Latest research signal | Why it matters |
|---|---|---|
| Reported 2026 price highs | Above $13,000–14,500/t | Demonstrates the scale of the rally, but not necessarily a sustainable average |
| Reuters analyst forecast | About $11,975/t average | Indicates elevated prices with some moderation from peak levels |
| S&P Global forecast | Just above $12,100/t average | Reflects concentrate shortages and limited new mine growth |
| Visible global inventories | Nearly 1.5 million tonnes | J.P. Morgan says stocks increased by roughly 540,000 tonnes during the year |
| Goldman Sachs 2026 market balance | Up to 300,000 tonnes surplus | Suggests high prices could encourage scrap, substitution and demand restraint |
| Bull-case range | Roughly $13,000–15,000/t | Depends on persistent disruptions, low stocks and renewed stockpiling |
Figures are drawn from the research and market reports cited below. They are analytical reference points, not trading guidance.
The record price is real, but the market is not uniform
Copper’s latest rally has been amplified by a geographical dislocation in metal.
U.S. buyers have been accumulating refined copper ahead of expected import measures and tariff decisions. That front-loading has drawn material toward the United States, particularly into COMEX-linked warehouses, while consumers in other regions have faced tighter prompt availability.
The result is a market in which high U.S. inventories do not necessarily signal abundant supply for every consumer. A fabricator in North America may have better access to nearby metal than a buyer in Europe or Asia, while the global benchmark continues to incorporate uncertainty about future trade flows.
Goldman Sachs Research has described this process as temporary scarcity created by stockpiling. Its analysis expects U.S. inventory accumulation to slow once tariff policy becomes clearer. That would remove one source of support for prices and allow attention to return to the broader refined-copper balance.
J.P. Morgan’s data point to the same tension from a different angle. The bank said visible global inventories had risen to nearly 1.5 million tonnes, an increase of approximately 540,000 tonnes during the year. That increase argues against treating every record price as proof of an immediate global shortage.
The more useful question is where the inventories are located, what form the metal takes and whether it can move to the consumers that need it.
U.S. tariff stockpiling has changed the price signal
Trade policy has become a near-term driver of copper prices alongside mine supply and industrial demand.
When buyers expect a tariff on imported refined copper, they have an incentive to bring material into the country before the measure takes effect. That can create a temporary import surge, tighten availability outside the tariff-exposed market and widen regional premiums.
The impact is not limited to the tariff rate itself. The timing of a policy announcement matters because it determines how long buyers continue front-loading purchases. A delayed decision can prolong uncertainty and encourage additional inventory building. A definitive decision can have the opposite effect by ending the incentive to accumulate metal ahead of the policy change.
Goldman Sachs expects prices to ease after tariff clarity, although the timing and size of the adjustment remain uncertain. Its January analysis placed copper near $13,000/t in the first quarter and projected a decline toward approximately $11,000/t by year-end, while estimating a fundamental fair value near $11,500/t.
That is an important distinction for corporate planning. A high spot price caused by import timing may support short-term margins, but it is less reliable than a sustained price increase supported by underlying consumption and constrained mine output.

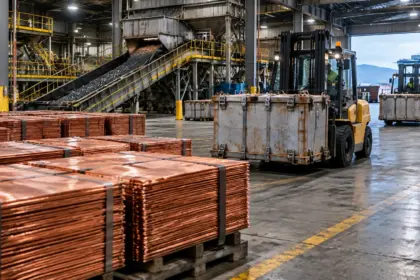
Flotation and concentration infrastructure is a critical link between mined ore and refined copper supply.
Mine supply remains the structural constraint
Copper’s long-term supply response is slow. New mines require years of exploration, permitting, construction and commissioning, while existing operations face declining grades, water constraints, equipment failures and rising operating costs.
J.P. Morgan highlighted disruptions at Grasberg in Indonesia, one of the world’s largest copper mines, following a fatal mudslide and force majeure. It also cited operational challenges at Quebrada Blanca in Chile, where guidance was reduced.
BMI lowered its forecast for global mine-production growth in 2026 from 2.8% to 2.4%, citing revisions to Chile’s outlook and continued constraints at Grasberg and Kamoa. The analysis, reported by Mining.com, also pointed to the limited pipeline of major new projects.
These disruptions matter because the copper market is large enough that even a modest reduction in expected output can shift the balance. If demand grows by roughly 2% while mine supply underperforms, a projected surplus can quickly become a deficit.
Supply risks are also appearing outside the mine gate. J.P. Morgan said China’s planned halt to sulfuric-acid exports could affect copper operations that rely on the chemical in leaching processes. The bank estimated that approximately 15% of global copper production is directly reliant on sulfuric-acid availability.
This creates a second layer of risk: even when ore is available, processing inputs and logistics can limit the amount of payable refined copper reaching the market.
Demand is broadening beyond traditional construction
Copper remains sensitive to global manufacturing, construction and consumer demand. But the composition of future demand is changing.
Grid expansion, renewable generation, electric vehicles, data centers and defense infrastructure all require copper-intensive power systems. Goldman Sachs estimates that grid and power infrastructure could account for more than 60% of copper demand growth through 2030 in its long-term outlook.
Artificial-intelligence data centers are an important part of that theme. Their demand for high-voltage connections, switchgear, transformers, cooling systems and backup power adds to broader electricity-network investment.
That does not make copper immune to a downturn. Data-center construction can be delayed, industrial projects can be repriced and manufacturers can substitute aluminum where engineering requirements allow. Goldman Sachs expects substitution to become more relevant if the copper-to-aluminum price ratio remains elevated.
The demand picture is therefore stronger than in a purely cyclical construction cycle, but it is not unlimited. Higher copper prices can encourage substitution, reduce consumption at the margin and accelerate recycling.
A three-scenario copper forecast
The following framework combines the published forecasts and market conditions described by Reuters, J.P. Morgan, Goldman Sachs and S&P Global.
| Scenario | Indicative 2026 range | Conditions |
|---|---|---|
| Bear | Below $10,000/t | Global growth weakens, Chinese demand slows, inventories unwind and scrap supply rises |
| Base | $11,000–12,600/t | Tariff stockpiling fades, mine supply remains constrained and grid demand offsets weaker cyclical consumption |
| Bull | $13,000–15,000/t | Major mine disruptions persist, ex-U.S. inventories remain tight and tariff or geopolitical buying returns |
Base case: elevated but moderating
The base case assumes that the strongest tariff-related stockpiling fades after policy clarity, while supply constraints prevent a rapid return to pre-rally prices.
Reuters’ analyst survey points to an average near $11,975/t, while S&P Global places its average just above $12,100/t. Other institutional estimates cluster around $12,000–12,600/t.
This scenario allows for periodic price spikes, particularly when exchange inventories fall or a major mine reports an outage. It does not assume that record prices become the new normal for every quarter.
Bull case: a physical squeeze returns
Copper could revisit or exceed its recent records if three developments occur together: mine disruptions persist, visible inventories fall again and U.S. or regional buyers resume aggressive stockpiling.
Citi and other bullish analysts have outlined scenarios approaching $15,000/t if supply remains restricted. Such a move would require more than strong long-term electrification demand. It would likely require a near-term physical shortage that consumers cannot easily solve through substitution or recycling.
Bear case: the inventory unwind begins
The bear case rests on normalization rather than collapse. If U.S. stockpiling ends, Chinese demand weakens and global inventories continue to rebuild, the market could focus on projected surpluses.
Goldman Sachs has estimated a possible 300,000-tonne surplus in 2026, while its earlier analysis referred to a larger surplus in the preceding year. Higher prices would reinforce the balancing response by bringing out scrap and encouraging aluminum substitution.
Under this scenario, copper could fall below $10,000/t, particularly if industrial growth slows at the same time.

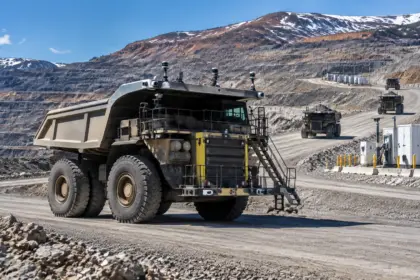
Concentrate logistics and regional warehouse flows will help determine whether tightness is global or localized.
The linkable hook: track the tariff-inventory divergence
A useful framework for market participants is a Tariff-Inventory Divergence Tracker. Rather than treating a single warehouse number or benchmark price as definitive, the tracker compares four indicators:
- U.S. warehouse inventories: Are stocks rising because of genuine domestic demand or pre-tariff imports?
- Non-U.S. exchange inventories: Are supplies rebuilding outside the United States?
- LME cash-to-three-month spread: Is the physical market rewarding immediate delivery?
- Mine guidance revisions: Are major producers replacing lost output or lowering forecasts?
The signal becomes most bullish when U.S. inventories are rising, non-U.S. stocks are falling, prompt spreads tighten and mine guidance deteriorates simultaneously. It becomes more bearish when stocks rebuild across regions, spreads normalize and supply guidance improves.
This framework helps separate a temporary trade-flow distortion from a genuine global shortage. It is also a practical way for procurement teams, miners and policymakers to explain why a record benchmark price may coexist with high inventories in one market.
What decision-makers should watch next
For the remainder of 2026, the most important indicators are:
- Final U.S. decisions on refined-copper tariffs and implementation timing.
- COMEX inventory growth compared with LME and other non-U.S. warehouse stocks.
- Production updates from Grasberg, Quebrada Blanca, Kamoa and major Chilean operations.
- Chinese refined-copper imports, manufacturing activity and warehouse drawdowns.
- Scrap availability and evidence of aluminum substitution.
- Grid, data-center and defense-related capital expenditure.
- Treatment and refining charges, which indicate competition for copper concentrate.
Copper’s record highs have exposed the market’s sensitivity to policy and logistics, but they have not resolved the underlying supply challenge. The most defensible 2026 outlook is therefore neither an assumption of permanent scarcity nor a quick return to surplus-era pricing.
Prices are likely to remain elevated, with the base case centred near $12,000/t. New records remain possible, but they require a renewed physical squeeze; one driven by mine underperformance, low ex-U.S. inventories or another round of trade-related stockpiling.
Sources
- J.P. Morgan Global Research: Copper outlook
- Goldman Sachs Research: Copper prices and the 2026 outlook
- Goldman Sachs Research: Why record-high copper prices may not last
- Reuters: Copper forecasts and analyst expectations
- S&P Global Market Intelligence: Copper market outlook
- Skillings: Copper records, M&A sequencing and streaming discipline
- Skillings copper coverage