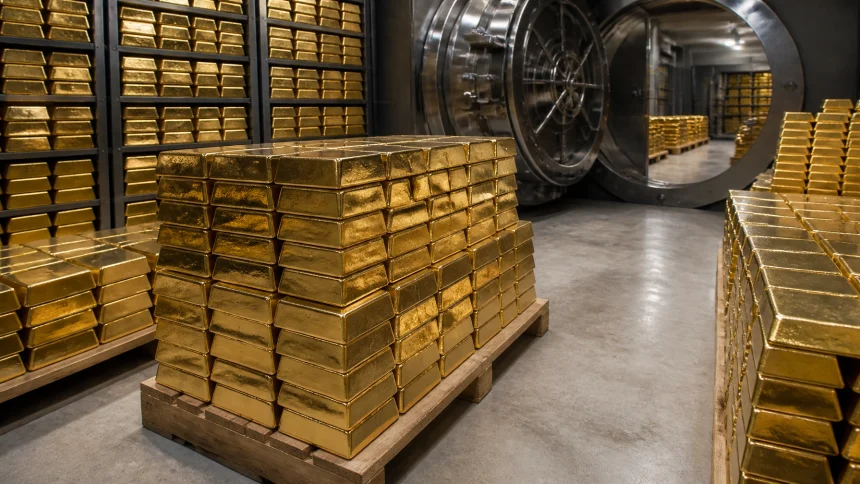
Gold prices are clinging to the critical $4,000 psychological floor this week as the precious metals complex navigates a volatile intersection of escalating geopolitical conflict and a hawkish shift in U.S. monetary policy. While gold has surrendered its recent highs to test November 2025 support levels, silver has staged a notable recovery, bouncing from an eight-month low to trade near $56.70 per ounce.
The dual pressure of rising energy costs: spurred by intensifying US-Iran hostilities in the Middle East: and a reinforced commitment from the Federal Reserve to combat persistent inflation has created a “tug-of-war” for safe-haven assets. For operators and investors in the mining sector, the current price action reflects more than just speculative sentiment; it signals a fundamental realignment of risk premiums as the industry looks toward the second half of 2026.
The Geopolitical Safe-Haven vs. Monetary Reality
The primary driver of the current market volatility remains the friction in the Middle East. Following a series of tactical escalations between Washington and Tehran, Brent crude oil has surged, briefly touching $112 per barrel earlier this week. In traditional market cycles, such a geopolitical flare-up would send gold into a parabolic rally. However, the 2026 landscape is complicated by the Fed’s aggressive stance on “energy-induced” inflation.
Since the flare-up began in late February, gold has actually struggled to maintain its peak valuations, falling approximately 14% from its year-to-date highs. This paradox is explained by the market’s pricing of the Federal Reserve’s next move. Data from the CME FedWatch tool now indicates a 31% probability of a 25-basis-point rate hike at the July 2026 meeting.
Higher interest rates increase the opportunity cost of holding non-yielding assets like gold and silver. Consequently, while the “war premium” is supporting gold at the $4,000 mark, the “rate-hike premium” is preventing it from breaking out toward previous resistance levels near $4,250.

Silver’s Resilient Rebound and the Indian Arbitrage
Silver’s trajectory has been even more dramatic. After crashing through technical support levels to hit an eight-month low of $54.20 last week, the metal has seen a surge in bargain buying. As of Monday’s close, spot silver had reclaimed the $56.70 level, driven in part by industrial demand and a unique supply-chain bottleneck in South Asia.
A significant factor in silver’s recent premium surge is the Indian government’s new import restrictions on silver dore and refined bullion. These policy changes have inadvertently driven local premiums in Mumbai and Ahmedabad to nearly $6.50 per ounce over the London spot price. This regional scarcity is forcing global arbitrageurs to pivot, providing a solid floor for silver even as the U.S. dollar strengthens.
Furthermore, the structural deficit in silver continues to plague the market. As explored in our Silver Price Breakout 2026 analysis, the transition to high-efficiency photovoltaic cells and the expansion of the regional AI-ready processing hubs in Southeast Asia have kept industrial consumption at record highs, even as investment demand wavers.

Operational Impact: Energy Inflation and Mining Margins
For mining companies, the $4,000 gold price is a necessary buffer against spiraling operational expenditures (OPEX). The US-Iran tension is not merely a headline risk; it is a direct cost driver. Diesel prices, which typically account for 10% to 15% of total site costs for open-pit operations, have risen for five consecutive weeks.
Companies operating in high-cost jurisdictions or those with lower-grade reserves are seeing their margins compressed despite the historically high metal prices. The “margin gravity” we previously documented in the lithium sector is now beginning to manifest in precious metals. In fact, many senior producers are reporting all-in sustaining costs (AISC) creeping toward the $1,800–$2,000 range, a level unthinkable just three years ago.
The monster storm impacts in Chile and other climate-related disruptions have already tightened the supply of byproduct silver from copper mines, further complicating the supply-side math for 2026.
Fed Rate Bets for July 2026: The Base, Bull, and Bear Case
As the market approaches the July FOMC meeting, three distinct scenarios are emerging for gold and silver:
- The Base Case (25 bp Hike): The Fed raises rates to curb oil-driven inflation. Gold likely dips below $3,900 temporarily but finds support from central bank buying. Silver remains range-bound between $55 and $60.
- The Bull Case (Pause): If geopolitical tensions de-escalate or economic data shows a cooling labor market, the Fed may pause. This could catalyze a gold rally back toward $4,300 as the dollar weakens.
- The Bear Case (50 bp Hike): An aggressive Fed “shock” to kill inflation could see gold break the $3,800 support, leading to a broader liquidation of precious metals by hedge funds and ETFs.
Currently, central banks remain the “buyer of last resort.” In our recent report on Gold Price Forecast 2026, we noted that sovereign accumulation: particularly in the BRICS+ bloc: has created a floor that didn’t exist in previous rate-hike cycles. This institutional support is why gold has managed to defend the $4,000 level despite the hawkish rhetoric coming out of Washington.

The 2026 Outlook: Technical Levels and Strategic Positioning
Technically, gold’s ability to close the week above $4,000 is paramount. A sustained break below this level could trigger a wave of algorithmic selling, targeting the $3,850 zone. On the upside, silver needs to clear $60.00 to signal that the eight-month low was a true capitulation bottom.
Investors should monitor the “inflation-breakeven” rates. If inflation expectations rise faster than nominal interest rates, real yields will fall, providing the perfect tailwind for a gold breakout. Conversely, if the Fed manages to convince the market that it can “look through” the oil price spike, the dollar will remain the preferred safe haven.
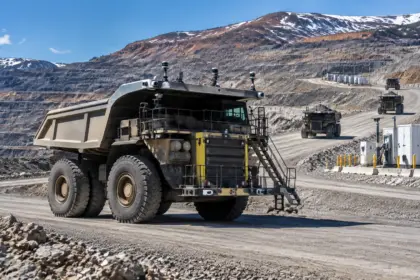
For mining executives, the focus remains on cost discipline and energy transition. Autonomous drilling and AI-integrated processing (as seen in our latest technology update) are no longer optional “innovation” projects: they are essential tools for surviving a high-OPEX, high-volatility 2026.
Market Intelligence Snapshot
| Commodity | Current Price (Spot) | 7-Day Change | YTD Change |
|---|---|---|---|
| Gold | $4,002.40 | -1.2% | +8.4% |
| Silver | $56.70 | +4.1% | -2.1% |
| Brent Oil | $110.15 | +6.5% | +18.9% |
| US 10Y Yield | 4.62% | +12 bps | +45 bps |