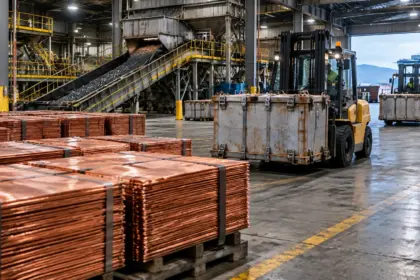
Silver bullion and refined metal are processed in an industrial refinery.
Silver’s latest move has shifted the market from recovery watch to breakout watch. The metal topped $69 an ounce on Friday, trading near $69.47 and gaining 2.23%, outperforming gold as the U.S. dollar slipped below 99.
The move cleared two closely watched levels: $66.55 and $68.02: and brought silver within reach of resistance around $69.48. A sustained break could put $71.03 in view, although the next leg will depend less on technical momentum alone than on Treasury liquidity, Federal Reserve expectations, industrial demand and the market’s ability to source physical metal.
The central question for operators, investors and analysts is whether the move marks the beginning of a broader supply squeeze or another sharp rally that attracts recycling and triggers demand destruction.
Market snapshot
| Asset or indicator | Latest market signal | Relevance to silver |
|---|---|---|
| Silver | Near $69.47/oz, up 2.23% | Breakout momentum is testing the $69.48 resistance zone |
| Gold | Underperformed silver on Friday | Indicates stronger silver-specific momentum |
| First technical support | $68.02/oz | Former resistance and immediate breakout retest level |
| Second technical support | $66.55/oz | Lower boundary of the recent breakout structure |
| Near-term resistance | $69.48/oz | A close above it would strengthen the bullish setup |
| Next upside level | $71.03/oz | Potential target if momentum remains intact |
| Dollar Index | Below 99 | A weaker dollar generally supports dollar-priced metals |
| CME FedWatch | About 36% probability of a September hike | Keeps policy uncertainty elevated |
The Friday move followed a broader advance in which silver pushed out of its mid-$60s range. Live market data from Kitco and Trading Economics showed the metal trading in the high-$69 range, although exact prices vary by spot and futures contract.
The technical picture is constructive, but it is not self-sustaining. Silver remains a relatively small and volatile market. A break above resistance can attract momentum flows quickly, while a reversal can be equally sharp if real yields rise or investors reduce exposure.
Why Treasury buybacks are supporting the move
The immediate macro catalyst has been the U.S. Treasury’s decision to increase selected long-end debt buybacks.
Under the Treasury’s buyback announcement, the maximum size of certain liquidity-support operations for longer-dated nominal Treasury securities will rise from $2 billion to at least $4 billion per operation. The operations cover parts of the 10-to-20-year and 20-to-30-year maturity sectors.
The move is intended to improve trading conditions in older, less-liquid Treasury issues. It is not a large-scale reduction in U.S. debt, but it can influence market pricing by absorbing securities from the long end and signalling that policymakers are concerned about liquidity and disorderly yield moves.
Reuters reported that the changes could add at least $14 billion of buybacks during the quarter, bringing maximum repurchases to roughly $83 billion when scheduled operations are included. That remains small compared with the size of the U.S. government bond market and the wider fiscal requirement.
The timing matters because total U.S. public debt has moved beyond $40 trillion, while Treasury continues to borrow heavily. The buybacks may help market functioning, but they do not resolve the underlying debt, inflation or long-term funding questions.
For silver, the transmission mechanism is indirect:
- Buybacks can reduce pressure at the long end of the Treasury curve.
- Lower long-term yields can reduce the opportunity cost of holding non-yielding metals.
- A weaker dollar makes silver cheaper for buyers using other currencies.
- Concerns about debt sustainability can reinforce demand for hard assets.
The Reuters account of the Treasury move and related market coverage indicate that yields initially fell after the announcement, while the dollar weakened. The effect should nevertheless be viewed as tactical rather than structural. If inflation remains firm or investors demand a higher risk premium for U.S. debt, yields can rise again despite the buybacks.
Fed expectations and the dollar remain critical
The silver rally is occurring without a clear assumption of imminent monetary easing. CME FedWatch pricing puts the probability of a September rate increase at approximately 36%, according to market reporting.
That creates a more complicated backdrop than the traditional “lower rates equal higher metals” relationship. Silver is benefiting from dollar weakness and lower yields in the immediate term, but policy remains restrictive enough to produce periodic pressure.
A stronger-than-expected U.S. employment report, inflation reading or Treasury auction could push yields and the dollar higher. That would challenge silver’s breakout even if the physical market remains tight.
Conversely, weaker economic data or further evidence that Treasury operations are being used to stabilise the long-end market could support the view that financial conditions are becoming less restrictive. In that environment, investment flows may become the marginal driver of silver prices.
Industrial demand is resilient, but solar thrifting is a risk
Silver’s long-term demand case remains tied to its role as a highly conductive industrial metal. Solar cells, electrical contacts, automotive systems, electronics, grid equipment and selected data-centre applications all require silver or silver-based components.
The Silver Institute’s supply-and-demand research shows that industrial demand reached a record 680.5 million ounces in 2024 before easing to about 657.4 million ounces in 2025. High prices, slower growth and manufacturing efficiency contributed to the decline.
Solar remains the largest swing factor. Manufacturers are reducing the amount of silver used per cell through thrifting and testing copper alternatives. The result is a race between two trends:
- Global solar installations continue to expand.
- Silver intensity per watt continues to decline.
The PV-focused market outlook places photovoltaic silver demand near 151 million ounces in 2026, down about 19% from the prior year in its base case. Other estimates are less negative, reflecting uncertainty over installation growth and the speed of substitution.

Silver conductive contacts are applied during automated photovoltaic cell production.
Solar demand can therefore remain strategically important even as its annual silver consumption declines. For the price outlook, the key issue is whether new panel volumes can offset lower silver loadings.
Other industrial segments provide partial support. EVs and advanced vehicles use silver in electrical contacts, sensors and power-management systems. Electronics and data-centre infrastructure also require highly conductive materials. These applications may not fully replace lost solar demand in the short term, but they broaden silver’s industrial base.
Supply remains slow to respond
The supply side is less flexible than the demand side.
Silver mine production is expected to remain broadly flat to slightly higher, with estimates generally clustered in the 820 million to 844 million ounce range. The Silver Institute and Metals Focus outlook points to another annual deficit, with the market shortfall estimated at about 46.3 million ounces.
A significant portion of silver is produced as a by-product of copper, lead, zinc and gold mines. That limits the direct response to higher silver prices. A copper operation will not normally accelerate production simply because silver rallies if copper economics, permitting or processing capacity remain the primary constraints.
Recycling is rising as prices improve. Silver recycling reached approximately 197.6 million ounces in 2025, and forecasts point to more than 200 million ounces in 2026. That increase helps narrow the deficit, but collection rates, scrap availability and processing economics limit how quickly recycled supply can respond.

Silver-bearing polymetallic ore moves through a modern processing plant.
Silver supply-demand mini table
| Measure | 2025 estimate | 2026 outlook | Market implication |
|---|---|---|---|
| Mine production | About 846.6 Moz | Roughly 820–844 Moz | No major primary supply surge |
| Recycling | About 197.6 Moz | Above 200 Moz | Higher prices encourage scrap recovery |
| Industrial demand | About 657.4 Moz | Firm but potentially lower | Solar thrifting is offset by electronics and EVs |
| Market balance | 40.3 Moz deficit | About 46.3 Moz deficit | Above-ground inventories remain important |
| Total supply | Around 1.03 Boz | Near 1.05 Boz in some forecasts | Supply growth still may not meet demand |
Forecasts differ because analysts use different assumptions for industrial demand, investment flows, hedging and recycling. The consistent message is that supply is growing too slowly to eliminate the deficit quickly.
Silver price prediction 2026: base, bull and bear cases
A single price target is less useful than a scenario framework. Published analyst views remain wide, with some institutional forecasts centred in the high-$70s to low-$80s and more bullish projections extending toward $90 or higher.
The following ranges frame the potential path from the current breakout zone into year-end.
| Scenario | Indicative range | Conditions required |
|---|---|---|
| Bear case | Below $60/oz | Stronger dollar, higher real yields, weaker investment demand and faster solar substitution |
| Base case | $65–$72/oz | Persistent deficit, firm industrial demand, gradual recycling growth and intermittent macro support |
| Bull case | Above $75/oz | Continued inventory drawdowns, sustained dollar weakness, renewed physical or ETF buying and supply disruptions |
The base case assumes silver holds above the former breakout levels and trades in a volatile but elevated range. A sustained close above $69.48 would improve the technical structure, while a move through $71.03 could signal that investment flows are beginning to reinforce the physical deficit.
A failure to hold $68.02 would weaken the immediate setup. A deeper move below $66.55 would suggest that the breakout has lost momentum and that macro pressure is again dominating the market.
The bull case requires more than industrial demand. It would likely need a combination of tight inventories, stronger investor participation and a weaker dollar. Silver’s smaller market size means those flows could produce an outsized price response.
The bear case does not require the physical market to move into a large surplus. Silver can decline if investors liquidate positions, real yields rise or industrial buyers reduce consumption faster than expected. A market deficit is supportive over time, but it does not prevent short-term drawdowns.
What to watch next
Four indicators will determine whether the $69 breakout develops into a broader supply squeeze:
- Federal Reserve expectations: Watch CME FedWatch pricing, inflation data and labour-market releases for changes in the probability of a hike.
- Treasury operations: Monitor the size, reception and market impact of long-end buybacks, as well as Treasury auction demand and 10-to-30-year yields.
- Industrial data: Solar installation growth, silver loadings per cell, electronics production and EV manufacturing will show whether substitution is accelerating.
- The gold-silver ratio: A falling ratio would confirm that silver is outperforming gold and gaining broader precious-metals momentum. A sharp reversal would indicate that the move is losing relative strength.
Silver’s outlook is constructive but highly conditional. The market is approaching a technically important resistance zone while facing a structural supply response that remains slow. If the dollar stays weak and investment demand absorbs available metal, prices can test levels above $75. If yields rise and manufacturers accelerate thrifting, the same market can reverse quickly.
The most useful conclusion for decision-makers is not a single forecast number. It is the interaction between liquidity, physical balances and industrial intensity. That interaction will determine whether silver’s run toward $69 becomes a durable repricing: or another volatile test of the market’s limited supply flexibility.
For broader context, follow Skillings’ metals price coverage, mining market intelligence and gold market analysis.