Global silver markets have entered a defining phase in 2026, holding a resilient trading range between $56 and $61.50 per troy ounce. Driven by persistent structural deficits stretching into their sixth consecutive year, the white metal continues to command intense scrutiny from industrial operators, institutional investors, and macroeconomic policymakers worldwide. While macroeconomic volatility and shifting central bank monetary paths create near-term friction, underlying supply constraints and surging photovoltaic and electronics demand provide a formidable price floor.
Understanding the trajectory of silver requires examining the convergence of macroeconomic policy, structural supply deficits, and jurisdictional risks in key mining jurisdictions such as Peru. As industrial requirements outstrip primary mine output and recycling rates, market analysts are re-evaluating long-term valuation models.
Macroeconomic Drivers: Federal Reserve Policy and Industrial Consumption
The broader commodity complex in 2026 remains highly sensitive to monetary policy adjustments by the United States Federal Reserve. As central banks navigate sticky inflation and labor market cooling, real yields and currency fluctuations directly impact precious metals pricing. Lower interest rates typically reduce the opportunity cost of holding non-yielding assets, supporting investment demand across bullion and exchange-traded products.
Simultaneously, industrial consumption serves as the primary engine behind silver’s valuation resilience. Unlike gold, which is predominantly held for monetary and jewelry purposes, over 50% of total annual silver demand originates from industrial applications. The global energy transition: specifically the rapid expansion of solar photovoltaic (PV) manufacturing, electrical vehicle (EV) electronics, and 5G infrastructure: consumes hundreds of millions of ounces annually.

According to data compiled from industry bodies and institutional research desks, technological substitution remains limited in critical solar cell architectures. Consequently, industrial off-take remains robust despite higher spot prices, cementing silver’s status as an indispensable industrial mineral.
Global Supply and Demand Balances
The defining characteristic of the 2026 silver market is the persistence of supply-demand deficits. Industry consensus points to a sixth consecutive year of negative net balances, driven by stagnant primary mine production and plateauing recycling volumes.
Global Silver Supply and Demand Balances (2023–2026E)
| Metric (Million Troy Ounces) | 2023 | 2024 | 2025 | 2026 (Est.) |
|---|---|---|---|---|
| Mine Production | 830 | 835 | 842 | 848 |
| Recycling | 178 | 185 | 197 | 216 |
| Total Supply | 1,008 | 1,020 | 1,039 | 1,064 |
| Industrial Demand | 654 | 680 | 695 | 712 |
| Jewelry & Silverware | 202 | 195 | 188 | 182 |
| Photovoltaic (Solar) | 161 | 185 | 198 | 210 |
| Total Demand | 1,152 | 1,178 | 1,186 | 1,211 |
| Market Balance (Deficit) | -144 | -158 | -147 | -147 (varies by model) |
Note: Figures synthesize data from the Silver Institute, Thomson Reuters GFMS, and major banking surveys. While specific deficit estimates vary between 45 million and 150 million ounces depending on inventory definitions, all primary models confirm multi-year structural shortfalls.
Peru Supply Risks and Latin American Geopolitical Dynamics
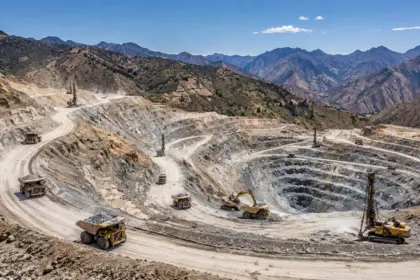
Mine supply dynamics across key South American jurisdictions continue to exert significant influence on global availability. Peru, consistently ranking among the world’s top silver producers alongside Mexico and China, faces ongoing operational headwinds that threaten projected output figures for late 2026.

Permitting delays, social opposition in rural mining communities, and declining ore grades at mature underground and open-pit complexes have constrained rapid production expansion. Because capital expenditure in new primary silver mines has lagged behind demand growth over the past decade, miners struggle to bring replacement ounces online quickly. Any localized disruption: whether from labor negotiations, environmental compliance audits, or regional infrastructure bottlenecks in Peru: immediately reverberates through global refining supply chains, intensifying spot market tightness.
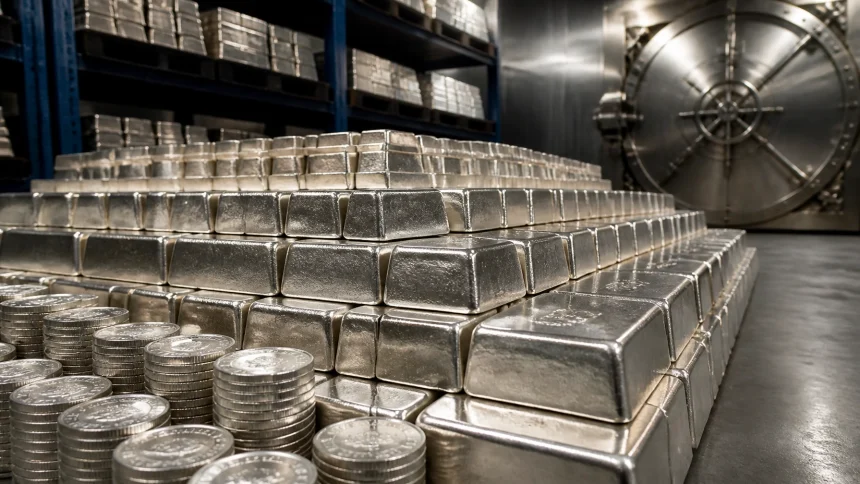
For operators and risk managers, monitoring jurisdictional stability in the Andean region is just as vital as tracking London Metal Exchange (LME) or COMEX vault inventories.
2026 Price Scenarios: Base, Bull, and Bear Cases
Navigating the silver market requires distinguishing between baseline operational trends and extreme tail-risk scenarios. Institutional forecasters currently frame the market across three primary trajectories:
1. Base Case ($70–$85/oz Average)
- Assumptions: Industrial demand maintains steady growth, particularly in solar and electronics; supply deficits persist at manageable levels (50M–100M oz); central banks execute measured interest rate cuts without triggering severe economic shocks.
- Outcome: Prices consolidate within higher bands, supported by structural deficits and consistent industrial consumption.
2. Bull Case ($90–$135+/oz)
- Assumptions: Deficits deepen due to major operational outages in Peru or Mexico; photovoltaic consumption accelerates beyond current projections; macroeconomic currency weakness and aggressive monetary easing drive heavy institutional investment inflows into precious metals.
- Outcome: Rapid depletion of visible vault inventories forces a short squeeze, pushing spot prices toward historical inflation-adjusted highs.

3. Bear Case ($50–$65/oz)
- Assumptions: Stronger-than-expected US dollar and persistently elevated real yields; global industrial manufacturing slows down; recycling volumes surge past expectations to capitalize on high metal prices, rapidly narrowing the supply gap.
- Outcome: Prices retreat toward the lower end of the current trading range as speculative long positions unwind and short-term surplus fears emerge.
Strategic Implications for Industry Stakeholders
The structural reality of six consecutive years of supply deficits forces a strategic reassessment across the mining value chain. Exploration and development companies holding advanced silver-copper-zinc assets are attracting heightened M&A interest from major producers seeking to replenish dwindling reserves.
Furthermore, industrial consumers: particularly in the solar and electronics sectors: are increasingly exploring long-term offtake agreements and direct mine-financing models to secure physical supply. In an environment where above-ground bullion inventories face steady erosion, operational agility and secure supply chain partnerships are paramount.

As the market absorbs second-half production data and monitors Federal Reserve policy signals, silver’s dual identity as both a precious monetary safe-haven and an indispensable industrial metal ensures it will remain at the center of global commodity discussions throughout 2026.