By Salini Krishnan
Target publish time: 4:00 PM ET
Gold pushed above US$4,500 an ounce while silver broke through US$68, but the more important investment question is whether mining equities and royalty companies are keeping pace with the metals. Across gold, copper, lithium and uranium, today’s market is being shaped by the same tension: strong prices are improving asset economics, while execution, permitting, supply chains and valuation discipline remain decisive.
The US Treasury’s announcement of increased long-term bond buybacks pushed yields lower and supported precious metals. At the same time, copper’s prompt-market tightness, lithium’s narrow surplus and uranium’s firm term market are creating a broader commodities backdrop for mining investors.
Market snapshot
| Asset | Indicative level | Market signal |
|---|---|---|
| Gold | ~US$4,512/oz | Above US$4,500; session high near US$4,528 |
| Silver | ~US$68/oz | Broke above US$66 as yields declined |
| LME copper, three-month | US$14,050–14,300/t | Cash premium and backwardation persist |
| Copper futures | ~US$6.49/lb | Prompt-market stress remains elevated |
| Lithium carbonate | RMB149,000–151,000/t | Rangebound, with supply and demand both firm |
| Uranium spot | ~US$88.25/lb | Near a six-month high; up about 20% year over year |
Levels are indicative and intended for market context, not trading purposes.
Gold’s breakout tests the equity discount
Gold’s move toward US$4,500 has widened operating margins for producers, but equity valuations have not uniformly followed the metal. A useful way to assess the gap is through price-to-net asset value, or P/NAV.
| Company group | Indicative P/NAV | Historical bull-market range |
|---|---|---|
| Senior producers | 0.75–0.90x | 1.20–1.35x |
| Mid-tier producers | ~0.70–0.75x | Typically higher during sustained rerating cycles |
| Juniors and developers | ~0.40–0.60x | Highly dependent on project stage and jurisdiction |
| Royalty and streaming companies | ~1.20–2.00x | Premium reflects cash-flow visibility and diversification |
Gold M&A transactions are averaging approximately 0.73x P/NAV, with announcement premiums generally around 35–45%. That gap can indicate potential value, but it is not automatically a discount worth pursuing.
A senior producer at 0.8x NAV may be inexpensive if it has long reserve life, low costs and a strong balance sheet. The same multiple may signal reserve depletion, rising sustaining capital, jurisdictional risk or weak cost control. For developers, the discount often reflects permitting, financing and construction risk rather than a simple market mispricing.
The key question is therefore not whether a company trades below historical multiples. It is whether the underlying NAV is achievable under realistic assumptions for gold prices, capital costs, operating performance and permitting.

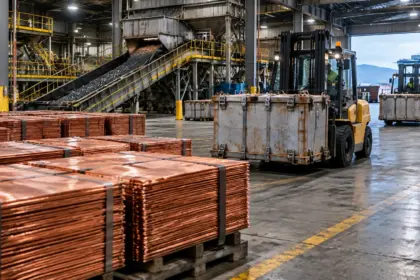
Gold concentrate and refinery equipment in a modern processing plant.
Royalty and streaming companies extend their scale
Royalty and streaming businesses are benefiting from higher metal prices without carrying the full operating cost of a mine. Their value depends on acquiring a contractual share of future production, usually in exchange for upfront capital.
Vox Royalty announced a binding agreement to acquire two Australian royalty interests from Latitude 66 Limited for up to A$3.4 million in cash. The package includes the Kalman copper-gold royalty in Queensland and the Sylvania royalty in Western Australia.
The Kalman interest covers a 2% production royalty on the relevant Queensland tenement. Sylvania includes a 1% net smelter return royalty on precious minerals and a 1.5% NSR royalty on other minerals, covering approximately 1,700 square kilometres of tenure. Completion of the Sylvania transaction remains subject to the applicable right-of-first-refusal process.
The deal is small relative to major streaming transactions, but it illustrates how royalty companies can recycle capital into portfolios spanning copper, gold and other minerals. Vox’s corporate disclosures and the transaction report from Mining.com.au provide further detail.
The wider sector is also expanding. Ecora Resources reported a 60% increase in critical-mineral income as base metals delivered a record quarter. Metalla Royalty & Streaming reported record second-quarter revenue of US$5.2 million, up 94% year over year.
Wheaton Precious Metals remains the clearest example of the model’s scale. The company reported second-quarter revenue of US$929 million and operating cash flow of US$650 million, while closing its US$4.3 billion Antamina silver stream with BHP. Wheaton’s share of Antamina silver production increased from 33.75% to 67.5%.
The company also added a US$275 million gold-silver stream on Jervois/KGL and a US$55 million royalty on Spanish Mountain. New CEO Haytham Hodaly has described a strategy targeting roughly one multibillion-dollar transaction each year, with an approximate 60% gold and 40% silver mix.
The model still carries risks:
- Mine construction or production delays can postpone cash flow.
- Operators may underperform technical or production guidance.
- The stream price may prove high if future metal volumes disappoint.
- Counterparty financial strength matters over the life of a contract.
- Concentration in one operator, mine or commodity can increase portfolio risk.
M&A premiums do not tell the whole story
The proposed OceanaGold-Ausgold transaction is a useful test of how investors should read headline premiums. Announced on August 17, the deal implies an equity value of approximately A$776 million, or about US$549 million.
Ausgold shareholders are being offered 0.03365 OceanaGold shares per Ausgold share, equivalent to roughly A$1.36 per share. The offer represents a premium of approximately 28% to the previous closing price and about 44% to the 20-day VWAP. A cash alternative pool of A$194 million is available, subject to scale-back if elections exceed the pool.
Completion is expected in December, subject to shareholder, court and regulatory approvals. The transaction would give OceanaGold its first Australian acquisition and exposure to the Katanning Gold Project in Western Australia. An updated December 2025 definitive feasibility study outlined a 2.44 million ounce resource and approximately 1.33 million ounces of reserves, with targeted average annual gold production of approximately 120,000 ounces over a mine life exceeding 10 years. The study estimated pre-production capital costs at approximately A$355 million, with first gold expected in 2029.
The deal is expected to be accretive to NAV per share once Katanning reaches commercial production. That qualification is important: the value is tied not only to the offer premium, but also to development execution.
A separate comparison is StrikePoint’s Northumberland transaction with Newmont, valued at up to US$98.94 million. The structure includes US$70 million upfront and two contingent payments of US$25 million each. The project contains approximately 2.86 million ounces of indicated gold-equivalent resources and 1.57 million ounces inferred. The upfront consideration equates to roughly US$16 per ounce, rising to about US$27 per ounce if the contingent payments are made.
Resource classification, grade, metallurgy, infrastructure, permitting and capital intensity can make two apparently similar per-ounce transactions economically very different.
Today’s broader deal flow includes AngloGold Ashanti doubling its stake in Thesis Gold through a US$58.5 million transaction and Gold Fields increasing its stake in Founders Metals to 20% for US$77 million. Strategic stakes can provide exposure to future M&A, but they should be assessed separately from a full acquisition premium.
Copper’s prompt squeeze widens forecast dispersion
Copper remains near record territory, with three-month LME prices around US$14,050–14,300 per tonne and futures near US$6.49 per pound. A cash premium and backwardation indicate that nearby metal is commanding a premium over later delivery.
LME stocks were indicated near 207,800 tonnes in yesterday’s market snapshot, reinforcing the focus on inventory and physical availability. Sprott has argued that the squeeze reflects a deeper supply problem, while RBC has noted that copper equities have lagged the metal.
Forecasts remain unusually dispersed:
| Institution or scenario | Copper assumption |
|---|---|
| TD Securities | ~US$13,000/t average; highs near US$15,000/t |
| ING | ~US$11,500/t |
| Commerzbank | ~US$14,000/t by year-end |
| Skillings bull-case framework | US$13,000–15,000/t |
The divergence reflects uncertainty around mine disruptions, smelter treatment charges, Chinese demand, scrap supply and aluminium substitution. For a fuller base, bull and bear framework, see Skillings’ copper price forecast.

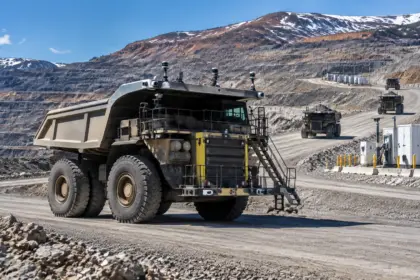
Open-pit copper operations and concentrator infrastructure in an arid mining region.
Lithium remains rangebound, but geopolitical risk is rising
Battery-grade lithium carbonate in China is holding around RMB149,000–151,000 per tonne. Supply from major mines is recovering, but downstream demand remains firm enough to keep the market rangebound.
The central supply question remains the pace of the CATL-related restart and the potential for a deficit if Chinese production normalisation is delayed. Skillings’ lithium price forecast examines how a projected surplus could narrow quickly if key Jiangxi supply remains offline.
Canada is also reviewing Lithium Chile’s proposed US$175 million sale to a Chinese buyer, adding a geopolitical layer to the lithium market. The review highlights how ownership of battery-material assets is increasingly being assessed through national-security and supply-chain lenses, not only project economics.

Lithium processing and ore-handling infrastructure at an industrial operation.
Uranium provides a separate energy-transition signal. Spot uranium is near US$88.25 per pound, while the term market is around US$97 per pound and the five-year forward assumption used in prior coverage is approximately US$105 per pound. Spot is up about 3.2% over the past month and 20% year over year. See Skillings’ uranium price outlook for the broader fuel-market and AI-power context.
Investor checklist
Before drawing conclusions from today’s market moves, investors and analysts should monitor:
- Copper: Whether backwardation and inventory stress persist.
- Forecasts: How analyst assumptions compare with realised prices and physical balances.
- Gold M&A: Headline premiums versus implied value per resource ounce.
- P/NAV: Reserve life, cost inflation, jurisdiction, permitting and balance-sheet assumptions.
- Streaming deals: Delivery terms, operator execution, counterparty strength and portfolio concentration.
- Uranium: The relationship between spot, term and longer-dated contracting activity.
- Gold equities: Whether valuation discounts reflect opportunity, execution risk or reserve depletion.
- Lithium: CATL restart timing, Chinese inventories and the outcome of Canada’s review of Lithium Chile’s transaction.
Shareable social snippet
LinkedIn/X: Gold is above US$4,500, silver is near US$68 and copper is trading around US$14,300/t; but mining-equity valuations still depend on execution. Today’s Skillings Mining Intelligence examines gold P/NAV discounts, royalty-sector scale, OceanaGold-Ausgold M&A premiums, the copper squeeze and lithium’s geopolitical risk.
Disclaimer: This newsletter is for information and market analysis only. It does not constitute financial advice or a recommendation to buy or sell any security.