As we move through the second quarter of 2026, the global mining sector is undergoing a profound structural “recognition cycle.” Capital is no longer flowing broadly into any project with a positive feasibility study; instead, it is concentrating into assets that demonstrate exceptional jurisdictional stability and operational resilience. For the institutional investor and the corporate operator, navigating this landscape requires moving beyond headline earnings and into the granular reality of asset valuation and supply-chain scarcity.
Today’s edition of The Investment Edge breaks down the critical shifts in valuation metrics, the accelerating consolidation within mid-tier energy metals, and the structural forces keeping uranium and silver at the center of the commodity bull run.
Market Snapshot: June 17, 2026
| Commodity | Spot Price | 24h Change | 2026 YTD | Sentiment |
|---|---|---|---|---|
| Copper (LME) | $11,420/t | +1.2% | +14.5% | Bullish |
| Uranium (U3O8) | $118.50/lb | +0.8% | +22.1% | Extremely Tight |
| Silver | $48.20/oz | +2.4% | +31.2% | Breakout |
| Gold | $2,645/oz | -0.3% | +12.8% | Consolidating |
| Lithium (Carbonate) | $18,400/t | -0.5% | -8.4% | Bearish |
1. The Lead: Why P/NAV is the Only Metric That Matters in 2026
In the prior decade, investors often relied on EV/EBITDA or P/E ratios to value mining equities. However, in 2026, those metrics have been sidelined by the Price-to-Net Asset Value (P/NAV) multiple. The reason is simple: in a high-inflation, high-interest-rate environment, current earnings are often a lagging indicator of a mine’s true worth. P/NAV, which calculates the market capitalization divided by the discounted cash flow (DCF) of all mining assets minus net debt, provides a forward-looking window into the life-of-mine value.
The Great Sector Bifurcation
We are currently witnessing a sharp bifurcation in P/NAV multiples across the sector. High-quality gold and copper producers with tier-1 assets are seeing P/NAVs trade at significant premiums, often between 1.1x and 1.3x. These “quality premiums” reflect the market’s willingness to pay for de-risked cash flows and established infrastructure in stable jurisdictions.
Conversely, battery metals: specifically lithium and nickel: continue to see P/NAV compression. With many projects facing downward revisions in price decks and rising operational costs, NAVs are being slashed. Investors are now applying “execution discounts,” often trading these companies at 0.5x to 0.7x P/NAV, reflecting skepticism over project timelines and long-term margin sustainability.
The Capital Discipline Filter
In 2026, P/NAV has also become the primary filter for capital discipline. Companies that have avoided over-leveraged M&A and maintained focused exploration budgets are being rewarded with multiple expansion. When the market sees a P/NAV above 1.0x, it is no longer just a sign of a “hot” stock; it is a vote of confidence in management’s ability to convert geological resources into shareholder returns without diluting the per-share value of the underlying assets.

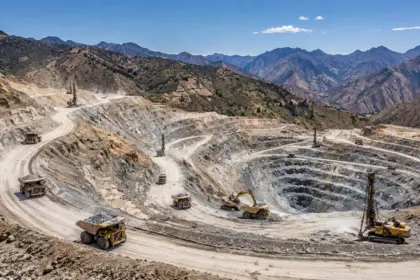
Scale and operational efficiency are the primary drivers of premium P/NAV valuations in 2026.
2. M&A Heat Map: The Shift to Mid-Tier Energy Metals
The M&A landscape in 2026 has shifted away from the speculative “land grabs” of the early 2020s. We are now in an era of strategic consolidation, where mid-tier producers are the primary targets for both diversified majors and sovereign wealth funds.
Consolidating for Scale
The “M&A Heat Map” is currently glowing brightest in the mid-tier copper and lithium segments. As the cost of greenfield development skyrockets, majors are finding it more efficient to acquire existing production or near-production assets. This is particularly evident in the Lobito Corridor, where logistic advantages are driving a flurry of joint ventures and bolt-on acquisitions.
Key trends observed this quarter include:
- Scale over Volume: Companies are prioritizing mergers-of-equals to create regional champions that can withstand commodity volatility.
- Jurisdictional Re-weighting: Assets in “friend-shored” regions (North America, Australia, parts of Africa) are commanding 20-30% premiums over similar-grade assets in high-risk jurisdictions.
- Vertical Integration: Automakers and battery manufacturers are moving from simple offtake agreements to direct equity stakes in mid-tier producers to secure their 2030 supply chains.
The Nickel Rationalization
While copper remains the “prestige” acquisition, the nickel market is seeing a “rationalization” phase. High-cost operations are being mothballed or sold to private equity groups specializing in turnaround situations. The focus for 2026 M&A in nickel is exclusively on Class-1 sulphide deposits that can meet the stringent ESG requirements of Western supply chains.

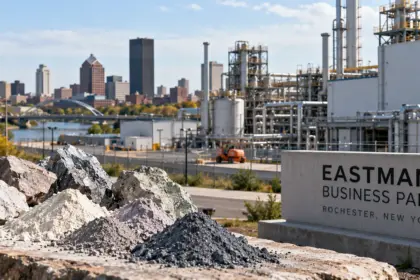
Modern M&A decisions are increasingly data-driven, utilizing real-time operational metrics to assess target value.
3. Commodity Forecast: Uranium and Silver Take Center Stage
The 2026 commodity narrative is dominated by two themes: the structural scarcity of uranium and the industrial breakout of silver.
Uranium’s Structural Scarcity ($100–$150/lb)
Uranium is no longer just a “recovery story”; it is a market in a state of chronic operational deficit. With global reactor demand surging: partially driven by the massive power requirements of AI data centers: utility companies are finding themselves with dwindling uncovered requirements.
As noted by recent reports from Energy Fuels and other domestic producers, the supply side cannot react quickly enough to current demand signals. Most analysts now view $100/lb as the new “floor” for uranium, with spikes toward $150/lb plausible if any major mine disruptions occur in Kazakhstan or Canada. The structural scarcity is exacerbated by a lack of mobile inventory, as strategic reserves in China and India remain locked away from the global spot market.
Silver’s $70 Breakout Floor
Silver has finally shed its reputation as “gold’s volatile little brother” and has emerged as a critical industrial metal in its own right. The dual demand from the solar photovoltaic sector and the next generation of electric vehicle (EV) power electronics has pushed silver into a sustained physical deficit.
The “breakout floor” narrative suggests that $70/oz is becoming the technical and fundamental support level for the metal. Unlike previous cycles where silver was driven by speculative retail interest, the current move is anchored by industrial consumers who must secure physical metal regardless of the price. As mine supply remains stagnant: silver is primarily a by-product of lead, zinc, and copper mining: there is little room for supply to catch up with this new industrial floor.

Conclusion: Navigating the 2026 “Recognition Cycle”
The theme for the remainder of 2026 is clarity. The market has moved past the “everything rally” and is now meticulously pricing risk, cost, and scarcity. Whether it is the rigorous application of P/NAV in the gold sector or the hunt for mid-tier copper scale, successful investors are those who prioritize asset quality over speculative growth.
As we continue to monitor the Uranium Energy Corp restarts and the evolving copper deficits, one thing remains clear: the mining industry is no longer on the periphery of the global economy: it is the foundation upon which the energy transition is being built.