On Monday, October 26, 2026, international Brent crude oil futures traded at US$115.16 per barrel in early morning dealings—down US$1.56, or 1.34 percent, from Friday’s six-month settlement high of US$116.72 per barrel after touching an intraday peak of US$117.45 per barrel—while U.S. West Texas Intermediate (WTI) crude traded at US$101.67 per barrel (Business Standard; Business Recorder). The 6 percent weekly jump in Brent was triggered by renewed Houthi missile and drone attacks on Saudi Arabian aviation and energy facilities alongside persistent Middle Eastern supply risks. While financial headlines focus on metal prices, sustained US$115+ Brent crude is quietly reshaping mining economics—transmitting cost inflation not only through diesel-powered haul trucks, but across the chemical, explosive, and processing supply chain.
Quantifying how crude oil affects mining margins requires distinguishing three cost metrics that are never interchangeable: Cash Operating Costs (such as Newmont’s Costs Applicable to Sales, or CAS, and S&P Global’s Total Cash Cost, or TCC), which measure direct site mining, processing, and freight expenses; All-In Sustaining Costs (AISC), which add sustaining capital, corporate overhead, reclamation accretion, and royalties to cash costs; and Development Capital (Capex), which funds long-term mine construction (Newmont Q3 Release; S&P Global Market Intelligence).
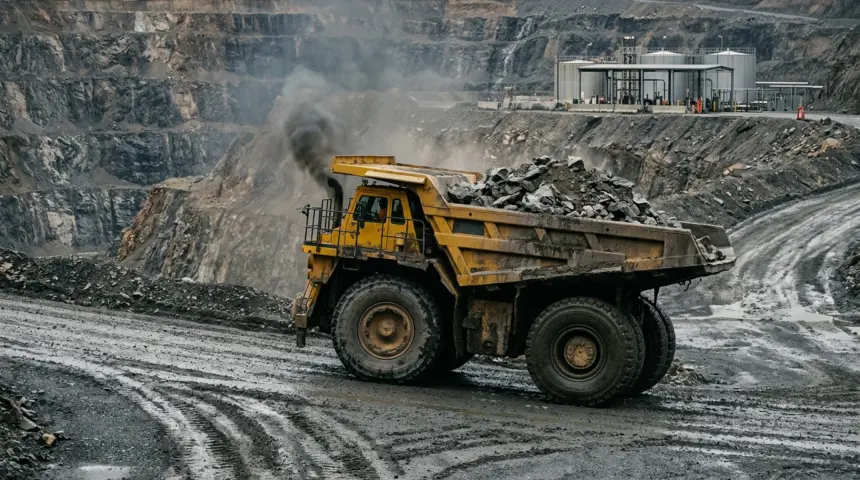
Newmont Corporation’s Q3 2026 release on October 22, 2026 provides the sector’s clearest quantitative benchmark for measuring both direct and indirect oil exposure. In its Assumptions and Sensitivities table, Newmont bases its 2026 guidance on a US$70.00 per barrel Brent crude assumption (Newmont Q3 Release). For every US$10.00 per barrel change in Brent from that US$70.00 baseline, Newmont estimates a pre-tax Direct Impact of US$60 million annually—capturing diesel burned in haul trucks, loaders, drill rigs, and mobile machinery, where diesel represents roughly 6 percent of direct operating costs (~US$12 per ounce on AISC across 5.26 million attributable gold ounces) (BigGo Finance / NEM Q3 Call).
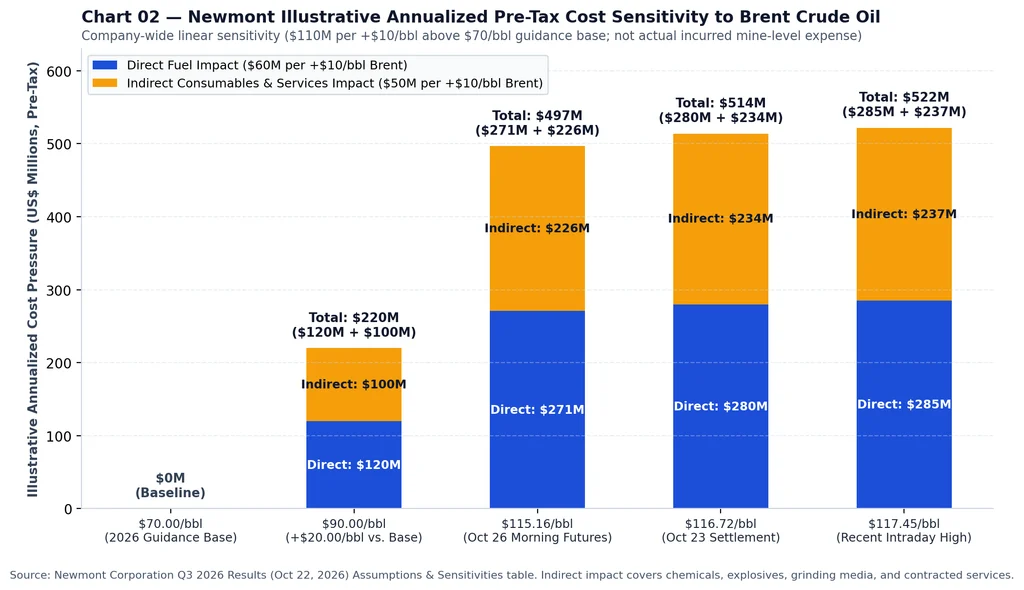
Crucially, in Q3 2026 Newmont introduced an enhanced disclosure: beyond the US$60 million direct fuel sensitivity, management estimates an additional US$50 million pre-tax annual Indirect Impact for every US$10.00 per barrel move in Brent (Newmont Q3 Release). Footnote 3 specifies that this indirect channel captures cost escalation in processing spend—including chemicals, ammonium-nitrate explosives, and grinding media—alongside fixed plant spend, mining spend, and contracted services. Combined, Newmont’s total illustrative pre-tax sensitivity is US$110 million per year (~US$21 per ounce) per US$10.00 per barrel change in Brent.
Applying Newmont’s disclosed sensitivities to current oil prices demonstrates the annualized pressure if US$115+ Brent persists. At US$90.00 per barrel (+US$20.00 vs. base), the illustrative annualized pre-tax impact is US$220 million (US$120 million direct plus US$100 million indirect). At Monday’s October 26 Brent price of US$115.16 per barrel (+US$45.16, or 4.516 increments of US$10), illustrative annualized pre-tax cost pressure reaches US$497 million—split between US$271 million in direct diesel fuel and US$226 million in indirect consumables and contractor costs. At the October 23 settlement of US$116.72 per barrel, the figure is US$514 million (US$280 million direct, US$234 million indirect), and at the recent US$117.45 per barrel intraday peak, it reaches US$522 million (US$285 million direct, US$237 million indirect). Analysts must note the limitations of these estimates: they are linear, company-wide pre-tax sensitivities assuming static, unhedged consumption rather than measured actual costs at a single mine (Newmont Q3 Release). Nevertheless, Newmont warned on October 22 that 2027 unit costs will trend higher due to inflation exceeding its 3 percent assumption, higher diesel prices, Australian dollar headwinds, and 30 percent lower Peñasquito silver credits (BigGo Finance / NEM Q3 Call).
A clearly dated historical case study from Teck Resources Limited’s 2022 financial reports illustrates how an oil shock transmits into open-pit mining and freight costs (Teck Q1 2022 Release; Teck Q2 2022 Release). In Q1 2022, Teck reported a 52 percent year-over-year increase in diesel prices alongside a 13 percent year-over-year increase in operating costs (INN / Teck Q1 2022). In Q2 2022, Teck reported a 75 percent year-over-year surge in diesel prices that drove a 14 percent year-over-year increase in operating costs, noting that roughly half of that 14 percent cost increase (~7 percentage points) stemmed from diesel at operations and in transportation (Teck Q2 2022 Release). Kept strictly in their respective 2022 quarters, these disclosures show the empirical cost pass-through of triple-digit crude.
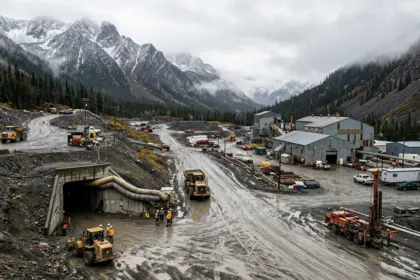
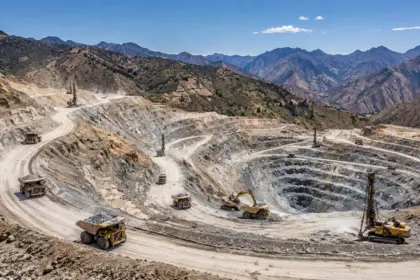
Operational exposure varies sharply by mine design and commodity. Remote open-pit mines face compounding geological headwinds: S&P Global Market Intelligence reports that global copper stripping ratios rose from 1.47-to-1 in 2021 to 1.80-to-1 in 2025 while head grades fell 13.4 percent over the prior decade to 0.52 percent Cu, pushing copper total cash costs per metric tonne of ore treated up 27.8 percent from US$23.64/t of ore in 2021 to US$30.21/t of ore in 2024 and an estimated US$32.24/t of ore in 2026. Conversely, underground operations on hydro grids—such as Red Chris connected to BC Hydro—avoid heavy diesel haulage (Imperial Metals).
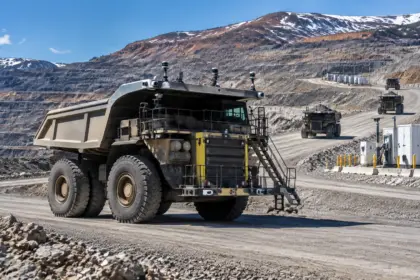
While gold producers enjoying approximately US$2,800/oz margins above AISC under H1 2026 conditions can absorb higher fuel bills, marginal battery-metal producers face acute risk. S&P Global forecasts 2026 average nickel AISC to rise 3.9 percent to US$5.89/lb against a US$7.49/lb consensus price, with H1 2026 cost-curve analysis showing 14 percent of global nickel output operating at a loss—especially coal-fed RKEF plants and reagent-heavy HPAL operations like Murrin Murrin, Ambatovy, and Goro (S&P Global Market Intelligence). In lithium (2026E average AISC US$5,887/t LCE; Argentine brines US$7,223/t LCE), H1 2026 conditions leave roughly 47 percent of lithium chemical output and 23 percent of spodumene concentrate above US$787/t SC6 FOB Australia operating at a loss on the cost curve, while sulfuric acid now consumes 15 to 20 percent of cash costs at copper leach mines (Skillings Mining Review). Operators can deploy autonomous haulage optimization (cutting fuel and tire use by 10–15 percent) and reagent digital twins immediately, whereas trolley-assist ramps, underground BEVs (reducing maintenance costs 25–30 percent), and renewable microgrids require multi-year capital cycles (Skillings Mining Review; Congruence Market Insights).
What development would materially change this article’s conclusion? A geopolitical de-escalation returning Brent crude below US$85–US$90 per barrel would remove roughly US$277 million of Newmont’s illustrative annualized cost pressure and relieve fourth-quartile battery-metal mines, whereas sustained Brent above US$125 per barrel into 2027 would accelerate supply curtailments across high-cost nickel HPAL and lithium spodumene operations.
Three Key Takeaways (Energy & Mining Costs)
- Brent Crude Above $115 Tests $70/bbl Guidance Baselines: With Brent crude trading at US$115.16/bbl on October 26, 2026 (after settling at US$116.72/bbl on October 23 and touching US$117.45/bbl intraday), Newmont’s enhanced Q3 sensitivity (US$60M direct fuel + US$50M indirect consumables/services = US$110M pre-tax per +US$10/bbl above its US$70/bbl base) implies US$497 million in illustrative annualized pre-tax cost pressure.
- Historical Transmission vs. Current Cost Structure: Properly separated historical disclosures from Teck Resources in 2022 demonstrate empirical diesel pass-through during oil shocks—in Q1 2022, a 52 percent YoY diesel increase accompanied a 13 percent operating cost rise; in Q2 2022, a 75 percent YoY diesel surge drove roughly half of a 14 percent operating cost increase.
- Severe Bifurcation Between Precious Metals and Marginal Battery Metals (H1 2026 Conditions): Gold producers with approximately US$2,800/oz margins above AISC in H1 2026 are compared here with an illustrative ~US$21/oz sensitivity for each US$10/bbl increase in Brent, not an observed AISC change, whereas S&P Global and H1 2026 cost-curve assessments show 14 percent of global nickel production (2026E AISC US$5.89/lb) and 47 percent of lithium chemical output (2026E AISC US$5,887/t LCE) plus 23 percent of spodumene concentrate above US$787/t SC6 FOB Australia operating at a loss.
Chart 02 & Historical/Sector Cost Comparison
Sources
- Newmont Corporation Q3 2026 Results — Assumptions & Sensitivities Table (Oct 22, 2026): https://www.sec.gov/Archives/edgar/data/1164727/000116472726000041/newmontq32026earningsrelea.htm
- Newmont Q3 FY2026 Earnings Call Summary — BigGo Finance (Oct 23, 2026): https://finance.biggo.com/quote/NEM/earnings-call/US_NEM_2026-10-22
- Business Standard — Brent Crude at $115.16/bbl & WTI at $101.67/bbl (Oct 26, 2026): https://hindi.business-standard.com/markets/commodities/crude-oil-prices-fall-brent-above-115-saudi-attacks-october-26-2026-id-562677/
- Teck Resources Q1 2022 Unaudited Results — 52% Diesel / 13% Operating Cost Increase (Apr 26–27, 2022): https://investingnews.com/teck-reports-unaudited-first-quarter-results-for-2022/
- Teck Resources Q2 2022 Unaudited Results — 75% Diesel / 14% Operating Cost Increase (Jul 26, 2022): https://www.teck.com/news/news-releases/2022/teck-reports-unaudited-second-quarter-results-for-2022
- S&P Global Market Intelligence — Mine Cost Outlook 2026 (Jan 30, 2026): https://www.spglobal.com/market-intelligence/en/news-insights/research/2026/01/mine-cost-outlook-2026-inflation-new-supply-reshape-global-mining-landscape
- Skillings Mining Review — AISC Trends 2026: Fuel and Acid Inflation (June 9, 2026): https://skillings.net/aisc-trends-2026-navigating-the-fuel-and-acid-inflation-crisis/