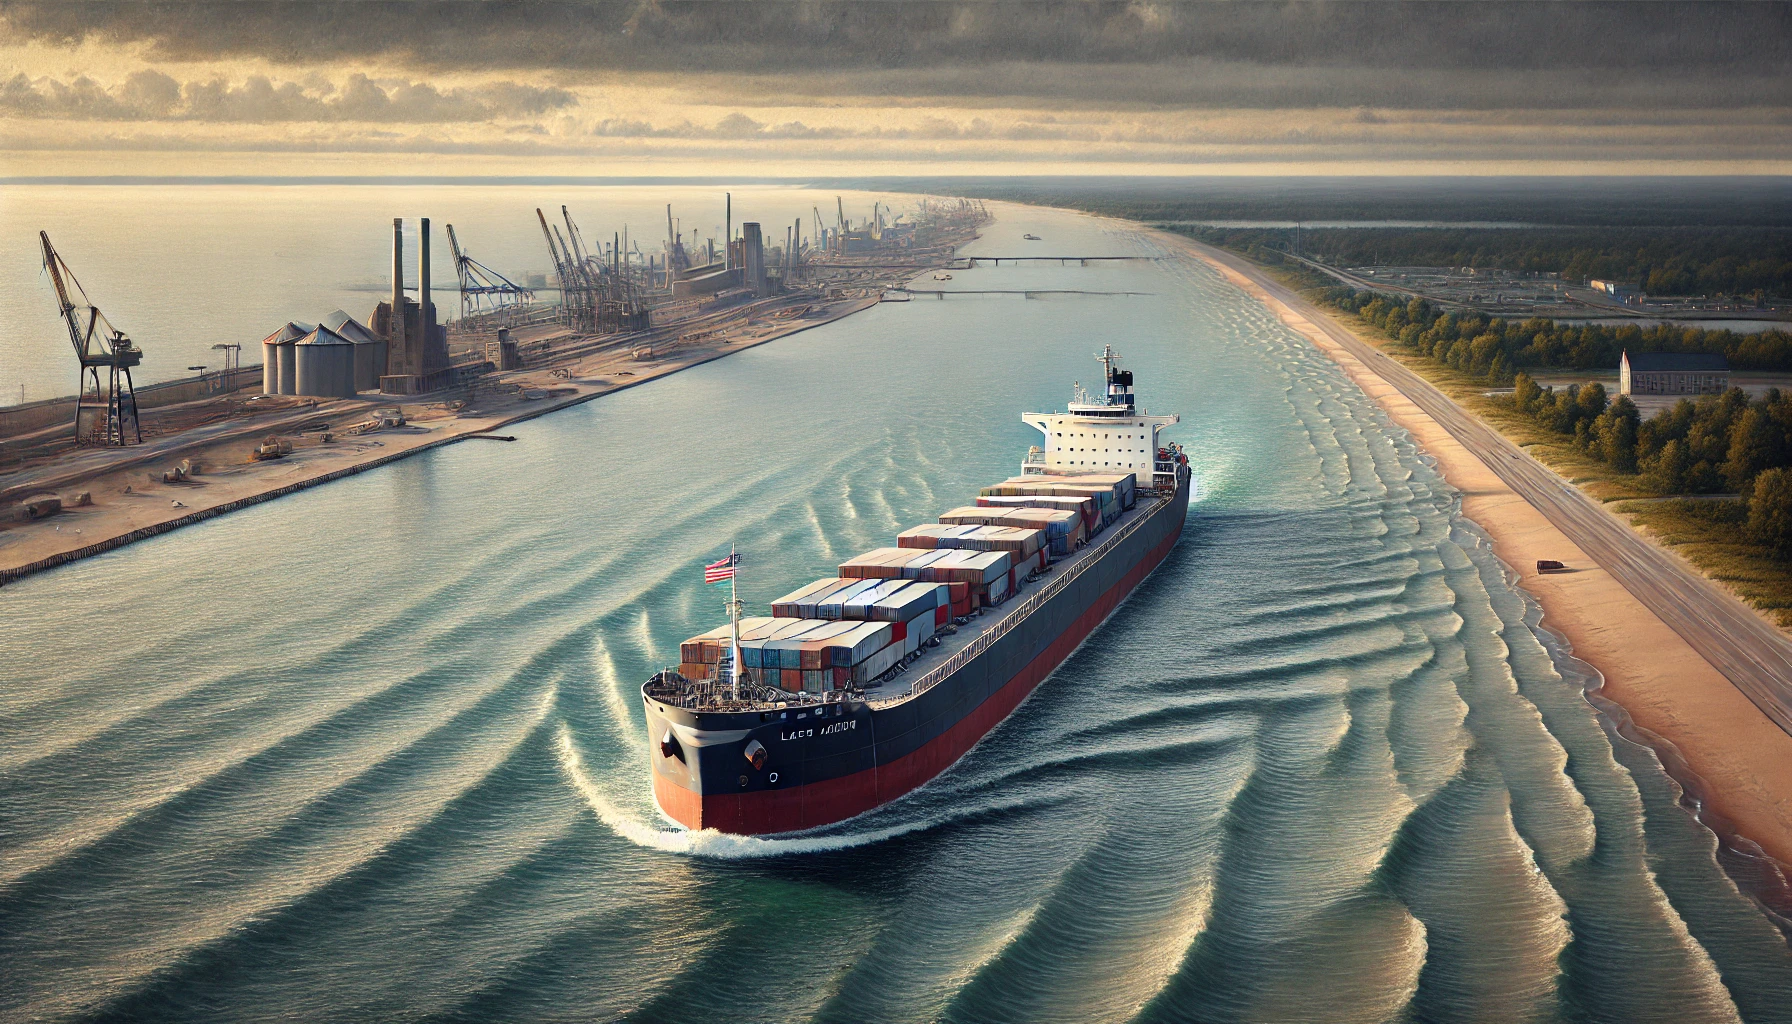
CLEVELAND—U.S.-flag Great Lakes freighters, commonly known as lakers, transported 78.2 million tons of cargo in 2024, a decline of 3.9% compared to the previous year. This year’s cargo movement also fell 2.1% below the fleet’s five-year average, reflecting shifts in shipping activity and economic factors influencing key industries.
- The Hidden Cost of Critical Minerals: How Rwanda’s Exploitation of Eastern Congo Fuels a 20-Year Crisis
- GoviEx Uranium Advances Muntanga Project with Strong Feasibility Study Results
- China’s dominance over critical minerals isn’t just an economic edge—it’s a global power move!
- Zulu Lithium and Tantalum Project: Premier African Minerals Secures $4.35 Million to Revive Operations
Commodity Breakdown
While total cargo movement declined, individual commodities showed varying trends:
- Iron Ore: The largest component of Great Lakes cargo saw a modest increase, with shipments totaling 43.9 million tons, up 3.6% from 2023. This marked a rebound for an industry vital to steel production and manufacturing.
- Salt and Sand: Salt shipments grew by 5.8%, while sand recorded the highest percentage increase at 15.2%, likely due to increased demand in construction and de-icing applications.
- Grain: Shipments experienced a slight dip of less than 1%, ending at 312,345 tons, indicative of relatively stable agricultural exports.
- Coal: Movement of coal declined significantly, dropping 12.7% to 7.3 million tons. Reduced reliance on coal for power generation and industrial use likely contributed to this decrease.
- Limestone and Cement: Limestone shipments saw a sharp decline of 14.5%, falling to 21.1 million tons, while cement shipments decreased by 6.3%, totaling 3.5 million tons.
Five-Year Trends
A review of cargo movement from 2019 to 2024 highlights fluctuating patterns across the Great Lakes. Iron ore remained the dominant commodity, averaging 41.6 million tons annually. Coal, which averaged 9.3 million tons, exhibited a steady decline over the five years, underscoring a shift toward cleaner energy sources. Other commodities, such as limestone and cement, maintained relatively stable but variable outputs in response to market demands.
The Role of the Great Lakes Fleet
The 2024 report underscores the dynamic nature of cargo transport on the Great Lakes, reflecting economic shifts and evolving industrial priorities. While some commodities saw gains, the overall decline highlights challenges facing the industry in a changing economic landscape. For more information on the Great Lakes fleet and its impact,
visit Lake Carriers’ Association.